Evaluation of "panels" in cancer diagnostics for Palacký University in Olomouc
Desktop program for spectrophotometric test evaluation. The program records the measured data, performs statistical processing and displays the resulting graphs. At the end it generates a report in the prescribed format. In this way, it handles multiple types of tests, where each test has its own processing and reports.
The program helps with cancer research at Palacký University in Olomouc.
Reason for creation and original SW Chemorezist
The MTT test can be used to evaluate patient reactivity to administered cytostatics or to test potential new drugs on cancer cell lines. The MMT test is simplified by a "panel" of small wells filled with the test substance and the colour of each well determines the efficacy of the substance, the drug.
In the LEM laboratory, this specific assay is used both for testing patient samples and for testing potential new cytostatics on cancer cell lines. It is clear from the nature of the assay that quality evaluation needs to be automated as much as possible due to the time and accuracy involved.
The program specification was based on the originally used and no longer fully compliant Chemorezist program, programmed in C++ with a database in dBase (dbf) format. The goal was to completely modernize the program, improve it and add additional functionality.
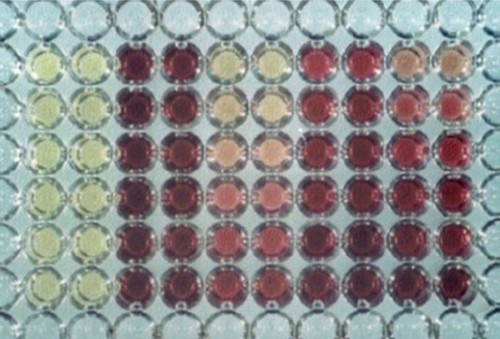
Fig. 1 - Example of a well panel.
The program was therefore rewritten from scratch in C#. Only the calculation algorithms (and unfortunately inaccuracies were found in several of them) and the stored database data were used from the original program. These were subsequently used to check the calculations during automated tests of the results. The data is stored on an MSSQL server. A web browser component was used to display the panel results, where "click" events are transmitted to the application. The program has an attached Java library that interleaves the measured points with a curve (see below).
The principle of the MTT test simply
The principle of the MTT test is essentially simple. We take cancer cells (from a patient or from a cell line when testing new drugs), add a known cytostatic drug at a known concentration, add a few chemicals, and use light transmission to measure how many cancer cells survived the "treatment". The more that survive, the darker the colour of the solution. Of course, we need to kill the cancer cells as selectively as possible, otherwise the best cancer cure would be cyanide.
MTT test in more detail
The survival of cancer cells is evaluated by spectrophotometry. This method is based on the reduction of yellow soluble 3-[4,5-dimethylthiazol-2-yl]-2,5-diphenyl tetrazolium bromide (MTT) to insoluble formazan (blue star-shaped crystals). The reaction takes place on the mitochondrial membrane of living cells. The formazan is dissolved by the addition of a strong detergent such as sodium dodecyl sulphate (SDS) or dimethyl sulfoxide (DMSO). The staining is evaluated spectrophotometrically at a wavelength of 540 nm. The absorbance value of the solution corresponds to the number of living cells (darker colour means higher light absorbance and thus a higher percentage of living cells). The staining of the sample wells can be assessed in this way by eye. The spectrophotometric measurement is of course more sophisticated, the "survival" result is calculated using a "blank" or "colour blank" and a "control". The EC value is calculated, i.e. what percentage of tumour cells survive at a given concentration of cytostatic. The EC50 value, i.e. the concentration at which 50% of the cells survive, is also important.
Application functions
From the analyst's point of view, the application differed in some points from conventional "form" database applications. Tumour cells are incubated in 96-well panels with different cytostatics (each cytostatic has its own concentration range). Thus, part of the application involved editing the series in a 96-well panel, see Figure 2.
This set "template" panel is then used, for example, to evaluate the efficacy of each "core cytostatic" for a particular patient. A different cytostatic, one of those set on the panel, may work on his tumour. In the case of testing a new drug, the situation is merely reversed, with different newly synthesised candidate drugs being applied to known cell lines.
Practical measurement is then carried out by preparing a 96-well panel according to the schedule from the template. The absorbance of each individual well is measured on a spectrophotometer and the measured result is digitally transferred to the program. The program uses the template to "know" what each well means, calculates all the necessary results and stores them in a database.
Another separate chapter of the program is the work with the graph. During the evaluation, the EC50 value (the mentioned concentration at which 50% of cancer cells survive) is calculated by interpolation. In addition, this program has a library (written in Java) that can interpolate the measured points of the graph in various ways with theoretical curves. Of course, the graph values can also be subtracted (see Figure 3 and the box at the bottom of the graph).
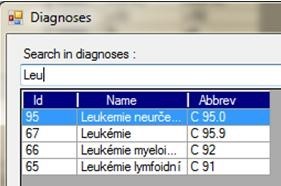
Fig. 4 - Diagnosis search.
The application also functions as a database repository. It contains a diagnosis codebook, patient results, results of potential cytostatics measurements, etc.
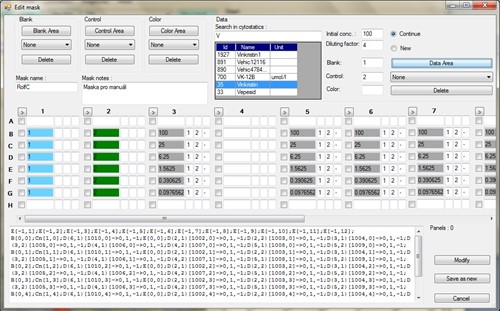
Fig. 2 - Editing the 96-well panel. Individual cytostatics and their dilutions are set.
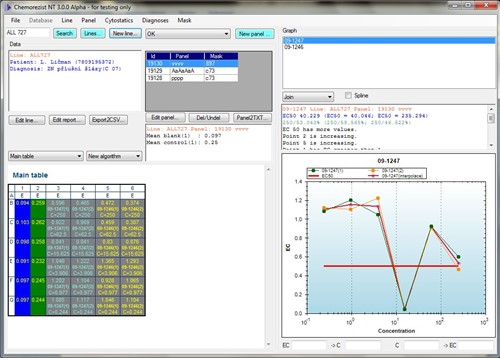
Fig. 3 - The main application form with a core web browser that displays the panel settings.
Experience and benefits
The program has already improved the measurements in the analysis phase, as the algorithm for calculating EC has been modified. Furthermore, it has accelerated the whole evaluation of this laboratory cytostatic assay, as the calculations are performed immediately using machine data from the spectrophotometer. It has sped up the entire "bureaucracy" around patient evaluation because it automatically "prepares" The patient evaluation protocol for printing, see Figure 5.
The program is still in use and has recently been updated.
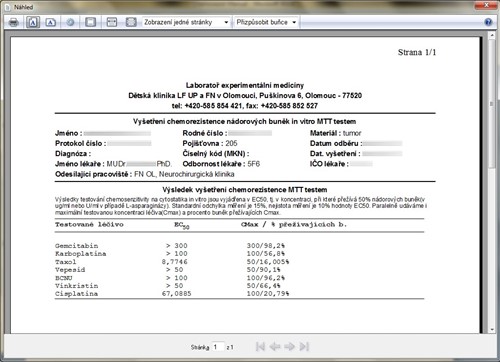
Fig. 5 - The patient evaluation protocol.